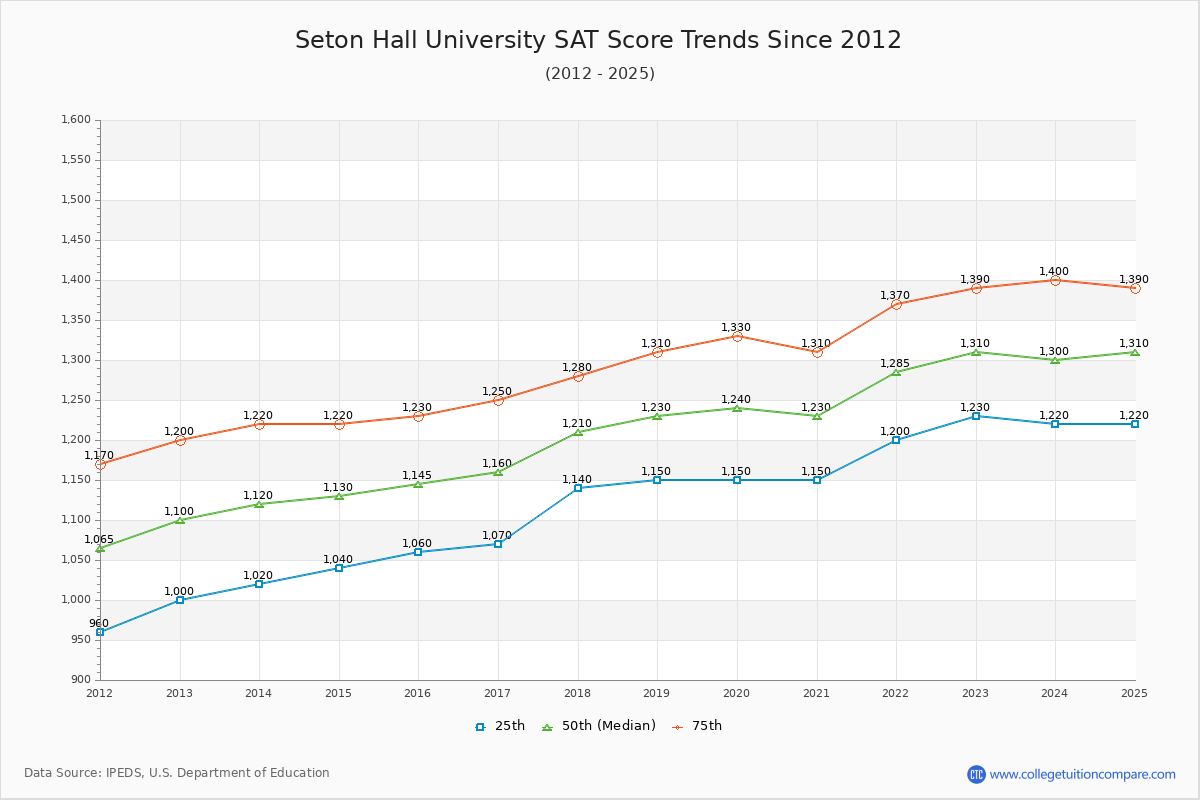
The SAT score have been increased 180 points since 2013 and it has risen almost every year over the past decade at Seton Hall. Compared to previous year, the SAT score decreased by 10 points at Seton Hall. Compared to similar schools, the submitted SAT and ACT scores are relatively competitive and high (above the national average) at Seton Hall.
You can check and compare colleges with similar SAT scores Seton Hall by SAT score range 1200-1300, 1250-1350, and 1300-1400.
The 2024 SAT score is 1300 at Seton Hall. Over the past 12 years, the average SAT score is 1130 (25 th percentile) and 1301 (75 th percentile). Compared to similar schools, the submitted SAT scores are competitive and high at Seton Hall.
The following table and chart illustrate the changes in SAT scores at Seton Hall University since 2013.
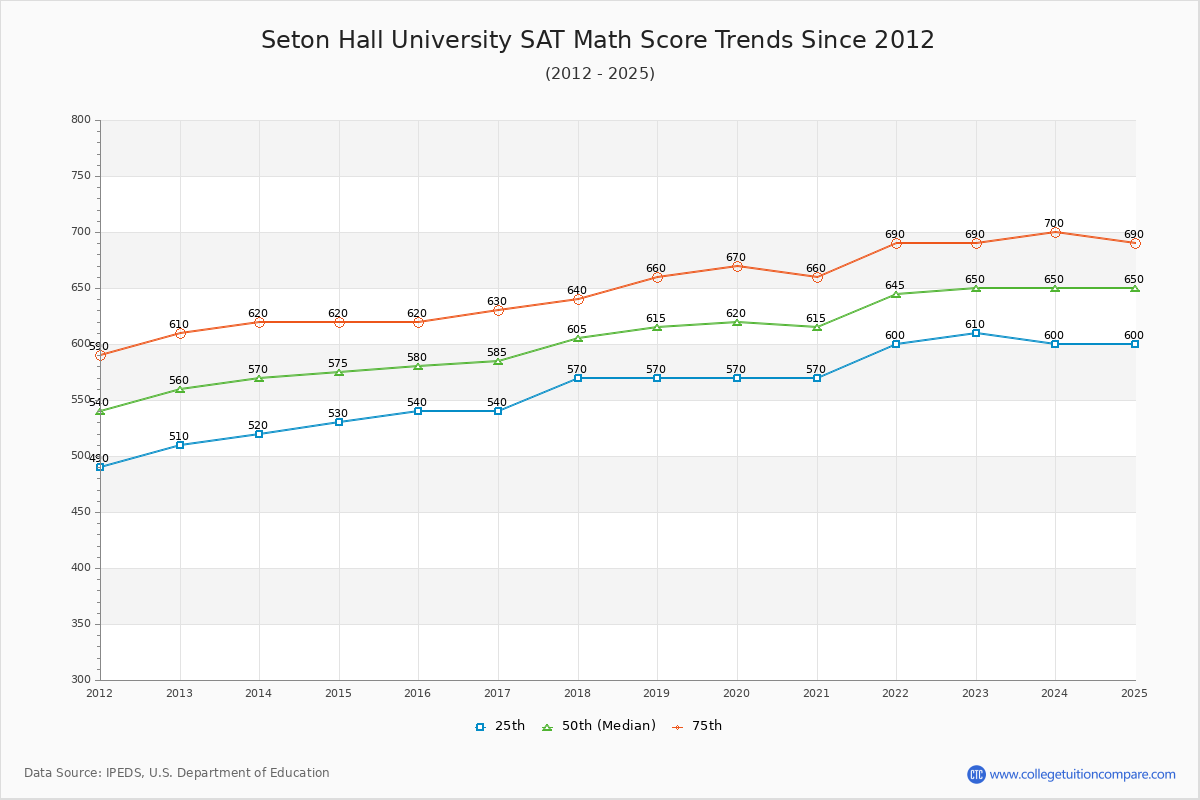
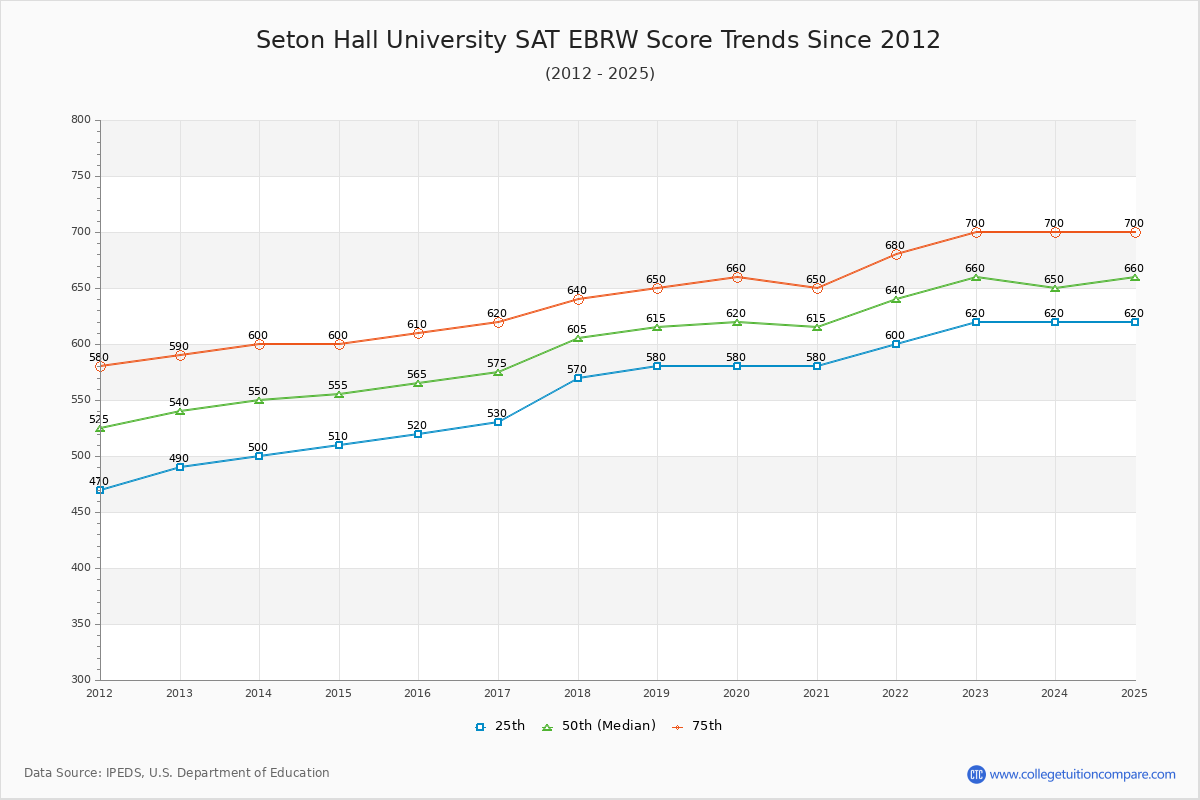
| Year | Total | Math | Evidence-Based Reading and Writing | ||||||
|---|---|---|---|---|---|---|---|---|---|
| 25 th | 50 th | 75 th | 25 th | 50 th | 75 th | 25 th | 50 th | 75 th | |
| 2013-14 | 1,020 | 1,120 | 1,220 | 520 | 570 | 620 | 500 | 550 | 600 |
| 2014-15 | 1,040 | 1,130 | 1,220 | 530 | 575 | 620 | 510 | 555 | 600 |
| 2015-16 | 1,060 | 1,145 | 1,230 | 540 | 580 | 620 | 520 | 565 | 610 |
| 2016-17 | 1,070 | 1,160 | 1,250 | 540 | 585 | 630 | 530 | 575 | 620 |
| 2017-18 | 1,140 | 1,210 | 1,280 | 570 | 605 | 640 | 570 | 605 | 640 |
| 2018-19 | 1,150 | 1,230 | 1,310 | 570 | 615 | 660 | 580 | 615 | 650 |
| 2019-20 | 1,150 | 1,240 | 1,330 | 570 | 620 | 670 | 580 | 620 | 660 |
| 2020-21 | 1,150 | 1,230 | 1,310 | 570 | 615 | 660 | 580 | 615 | 650 |
| 2021-22 | 1,200 | 1,285 | 1,370 | 600 | 645 | 690 | 600 | 640 | 680 |
| 2022-23 | 1,230 | 1,310 | 1,390 | 610 | 650 | 690 | 620 | 660 | 700 |
| 2023-24 | 1,220 | 1,300 | 1,400 | 600 | 650 | 700 | 620 | 650 | 700 |
| Average | 1130 | 1215 | 1301 | 565 | 610 | 655 | 565 | 605 | 646 |
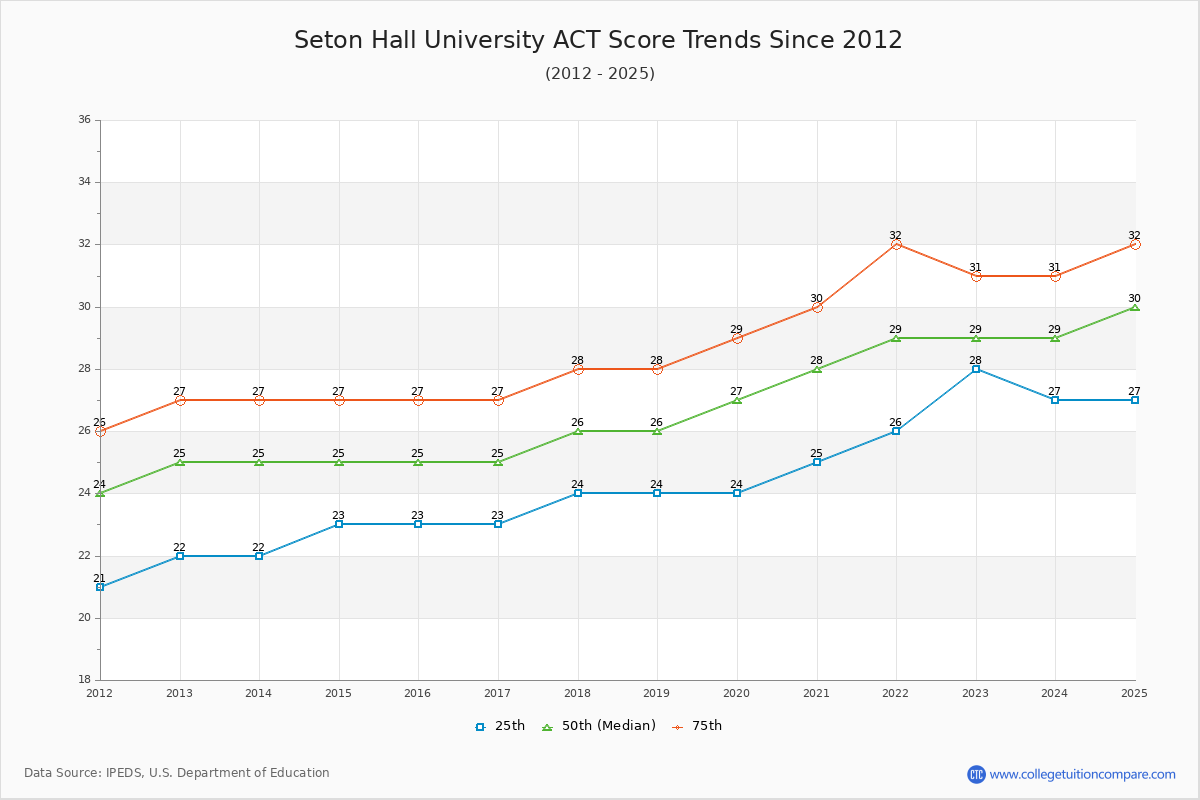
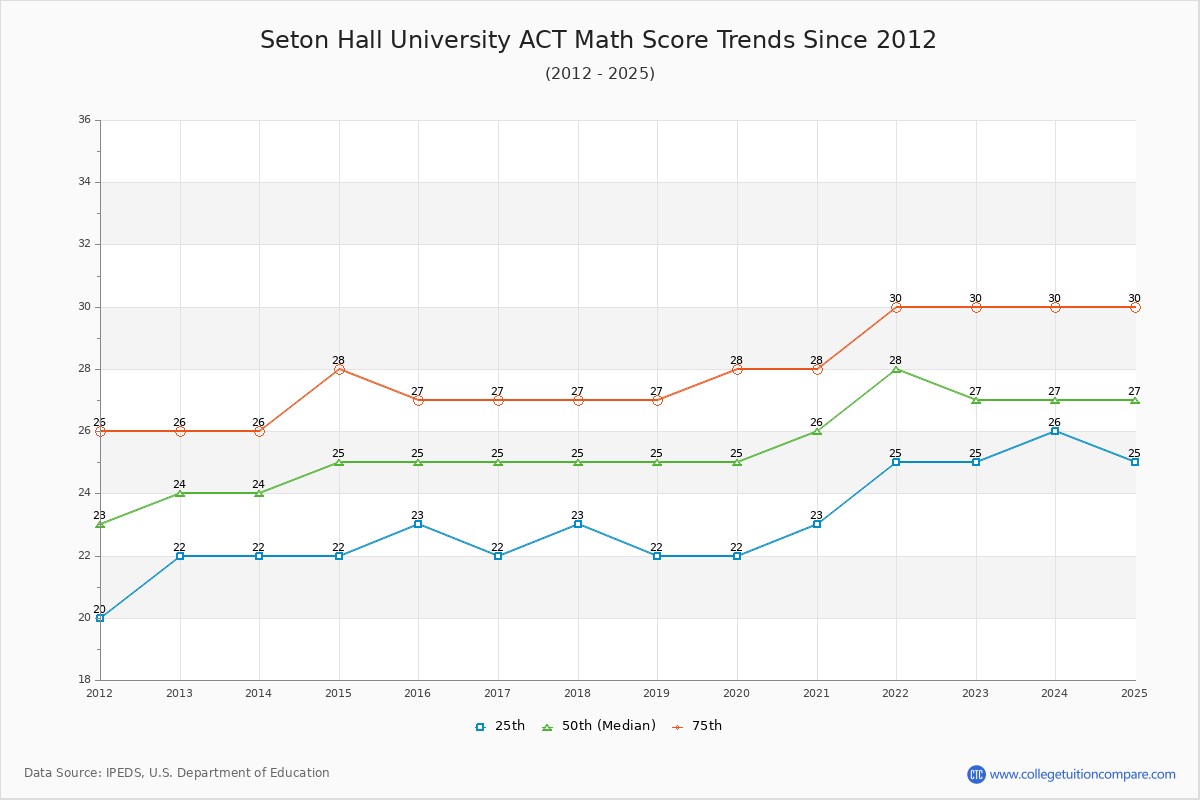
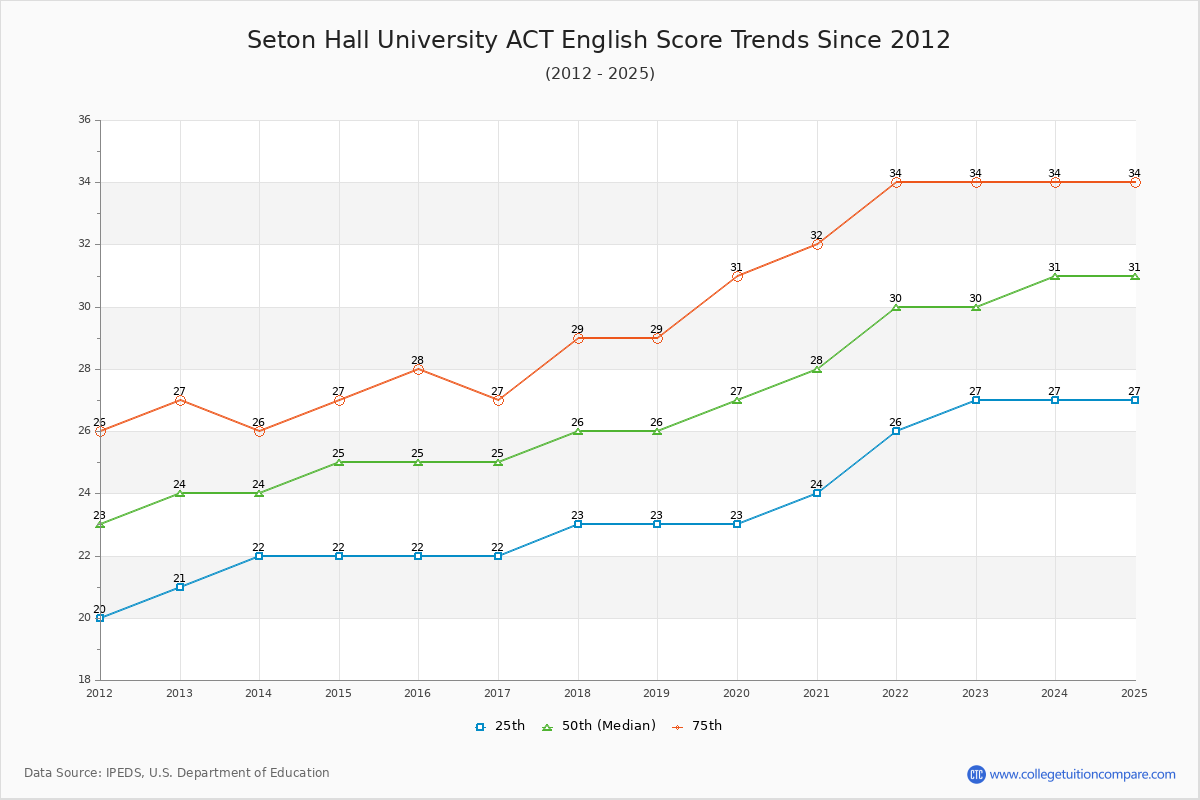
The 2024 ACT score is 29 at Seton Hall. Over the past 12 years, the average ACT score of the last 12 years is 24 (25 th percentile) and 29 (75 th percentile). Compared to similar schools, the submitted ACT scores are relatively competitive and high (above the national average) at Seton Hall.
The following table and chart show the changes in ACT scores at Seton Hall University since 2013.
| Year | Composite | English | Math | ||||||
|---|---|---|---|---|---|---|---|---|---|
| 25 th | 50 th | 75 th | 25 th | 50 th | 75 th | 25 th | 50 th | 75 th | |
| 2013-14 | 22 | 25 | 27 | 22 | 24 | 26 | 22 | 24 | 26 |
| 2014-15 | 23 | 25 | 27 | 22 | 25 | 27 | 22 | 25 | 28 |
| 2015-16 | 23 | 25 | 27 | 22 | 25 | 28 | 23 | 25 | 27 |
| 2016-17 | 23 | 25 | 27 | 22 | 25 | 27 | 22 | 25 | 27 |
| 2017-18 | 24 | 26 | 28 | 23 | 26 | 29 | 23 | 25 | 27 |
| 2018-19 | 24 | 26 | 28 | 23 | 26 | 29 | 22 | 25 | 27 |
| 2019-20 | 24 | 27 | 29 | 23 | 27 | 31 | 22 | 25 | 28 |
| 2020-21 | 25 | 28 | 30 | 24 | 28 | 32 | 23 | 26 | 28 |
| 2021-22 | 26 | 29 | 32 | 26 | 30 | 34 | 25 | 28 | 30 |
| 2022-23 | 28 | 29 | 31 | 27 | 30 | 34 | 25 | 27 | 30 |
| 2023-24 | 27 | 29 | 31 | 27 | 31 | 34 | 26 | 27 | 30 |
| Average | 24 | 27 | 29 | 24 | 27 | 30 | 23 | 25 | 28 |
The following table compares SAT score changes from last year between Seton Hall University and similar schools.
| 2024 | 2023 | Change % | |
|---|---|---|---|
| Seton Hall University | 1310 | 1285 | 1.95% |
| Marquette University | 1270 | 1270 | - |
| Creighton University | 1320 | 1250 | 5.60% |
| Georgetown University | 1500 | 1480 | 1.35% |
| Butler University | 1230 | 1245 | -1.20% |
| Xavier University | 1210 | 1185 | 2.11% |
Share your experiences and thoughts about Seton Hall University. It will be a great help to applicants and prospective students!